The Evolution of Collecting Student Feedback
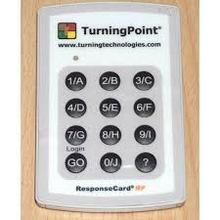
Our librarians have been collecting student feedback at the end of instruction sessions for well over a decade. In the 2007-2009 era, we were one of the few departments on our campus to use Clickers — does anyone remember those? — and they were good for getting anonymized pop-quiz assessment data and for injecting some novelty and humor into library sessions. With software and hardware changes and a campus switch to Mac OS, however, they eventually became more trouble than they were worth. Today the plastic shoebox of numbered remotes serves as my footrest under my desk.
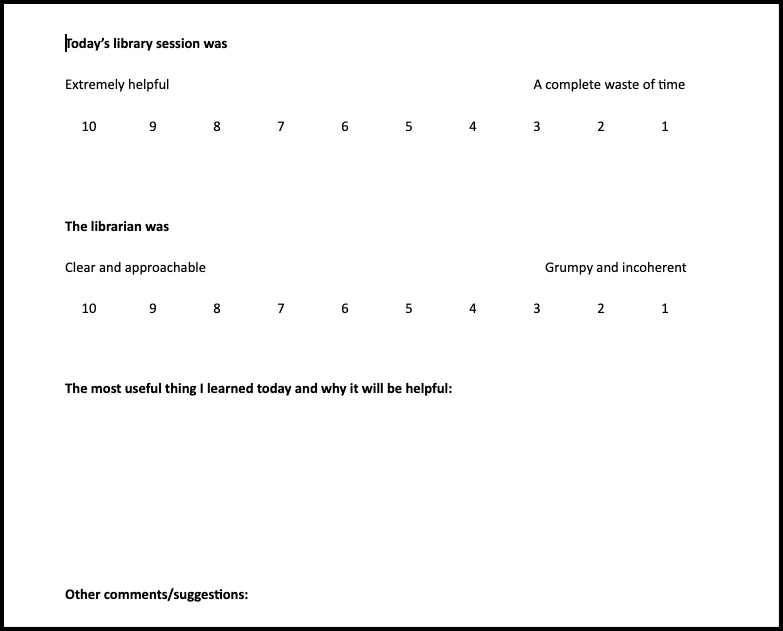
Around 2009, I began to hand out printed half-sheets of paper with Likert scales for students to rate their satisfaction with the session, plus a prompt for a “one-minute paper” about how they expected to use the knowledge they had gained. I would go through the papers after every class session and transcribe and code the results. It was time-consuming (and sometimes humbling) work, but it gave me a good sense of what the students had to say about our research instruction and how it could be improved. This method also gave us some basic quantitative data to present to the administration.
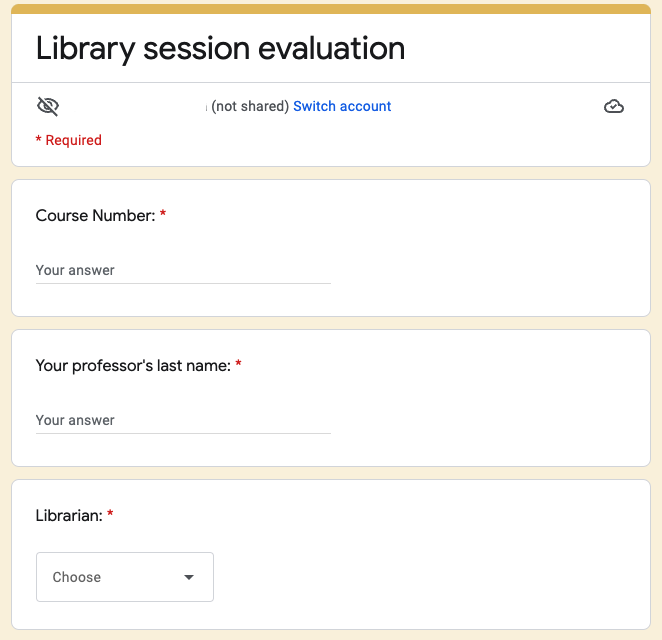
In 2014, we transitioned the same template to a Google Form survey. All of our students receive a Macbook (and, at the time, an iPad) and are expected to bring a mobile device to every class, so this was feasible. The electronic version retained the Likert scales for rating the librarian’s clarity and approachability, as well as another scale to rate the session’s overall helpfulness. It also included long-answer boxes for students to share “The most useful thing you learned today and why it will be helpful” as well as an option to share any general comments they might have.
We embedded the Google Form into a LibGuide page that could be reused on subject guides and also to have the “friendly URL” as another distribution option. From a data-management perspective, moving the survey to Forms made my life a lot easier. Responses were exported into a Google Sheets spreadsheet and I could run the average Likert scale scores in seconds. All of the librarians could access the spreadsheet, so each librarian instructor could access, copy, and manage the data from their classes if they liked while still allowing me to retain the comprehensive dataset.
With a few minor adjustments to the questions over the years, this is how we collected student class feedback from 2014 until this past academic year. As Fall 2021 loomed and I reflected that the Likert scale scores had remained consistent for seven years, I decided that continuing to collect those numbers was unnecessary. I eliminated the Likert scale questions. I reworded the first free-answer question, which asked students to identify what they believed would be the most useful takeaway from the session and why. I also changed the second long-answer question to give them an opportunity to leave a question, rather than the vague “any other comments?” prompt we had used previously.
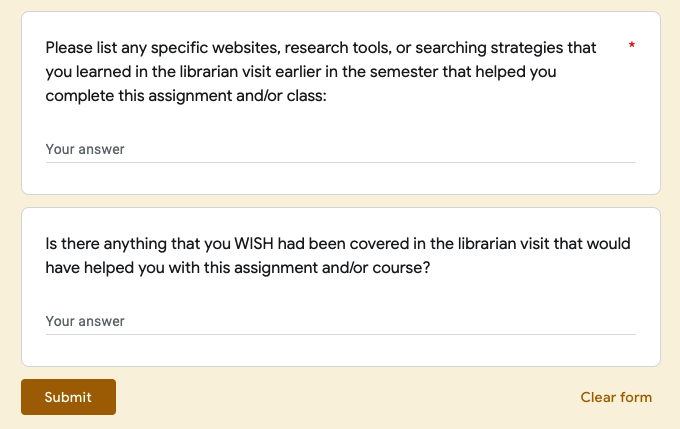
I also created a follow-up library session survey for distribution to students later on in the term, after they had a chance to put our teachings into practice. This survey asked the students to list any specific tools, sites, or strategies that they ended up using, and it also asked if there were any areas where they thought more guidance would have helped. The follow-up survey was sent to faculty either several weeks after the class visit or shortly after a major assignment due date, if we knew when a significant research project was due.
This was a major improvement, but we only used it for one semester! In early January 2022, my director asked me to take a look at ACRL’s Project Outcome. I had heard of it before but somehow had never looked into it; for some reason, I had the impression that it cost money and/or was better suited for large institutions. But I registered for an online presentation about it (“ACRL Project Outcome: Closing the Loop: Using Project Outcome to Assess and Improve a First-Year English Composition Information Literacy Program,” recording available here: https://youtu.be/ICDwuMRc3uY).
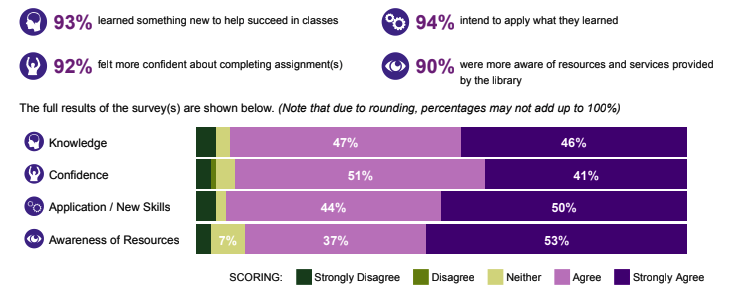
What struck me most as I learned about Project Outcome was that after all of my years of trial and error, the current iteration of my homegrown Google Form survey and the new follow-up survey were virtually identical to the surveys Project Outcome uses. When I realized that Project Outcome would allow me to instantly generate a visual representation of the students’ feedback, as well as compare our results to our Carnegie class peers across the nation, I was sold. Our provost favors quantitative data, and like most university administrators, she has many demands on her time. I’m excited to include this data comparison and visualization in our annual report, as I think it “tells our story” in a numerically-based and quick-to-comprehend way.
I am still learning my way around the Project Outcome dashboard and learning how best to administer and manage the surveys. Embedding the survey into a LibGuide page, as I had done with the Google Form, was a definite fail. Many students could not get the embedded survey to load. Fortunately, the direct URL to the survey is brief enough to post on the presentation screen, and I also made the old LibGuide “friendly URL” simply redirect to it. This seems to be working well. Participation in the follow-up survey is low and probably self-selects to more motivated students, but that is an expected limitation. Overall, I look forward to gathering more student feedback via Project Outcome and learning more about the ways that it allows us to analyze and present that data.